As we started Q4 in 2019, we saw the economic cycle coming to an end. We were slightly perturbed that markets wanted to be quite bullish as Q3 numbers showed firms meeting and beating expectations. However, expectations had been downgraded and reflected an overall weaker operating environment.
As the coronavirus story grew we were concerned about was supply disruption given China’s role in global growth, and we thought the knock-on effects were going to be substantial. Then markets realised this virus was a global problem. Around the same time, Russia and OPEC (Organization of the Petroleum Exporting Countries) decided it was the time for an oil price war. ETFs (Exchange-traded funds) were hit first, and you saw solid BB companies with good cashflows suffering. Selling across the board was felt very deeply, and at times disproportionately for higher rated credits. The market was essentially broken.
Central banks responded by attempting to maintain market liquidity. As a result of all the pandemic financial support programs central banks’ balance sheets have grown – the European Central Bank (ECB) by €645 billion, and the US Federal Reserve’s by $2.3 trillion.1 Fed action sought to buy the “Fallen Angels” – bonds that were investment grade but whose credit ratings had been reduced to junk bond status – and high yield ETFs. There was also talk that the ECB might follow suit.
So where this year’s market turbulence started with phase 1 (total collapse), then moved to phase 2 (massive central bank and government intervention resulting in a strong bounce back), we then moved into phase 3 (the reality check), whereby real economic figures are generally turning out worse than expected. The risk of some issuers missing coupon payments has become a reality.
Market flows amid covid-19
As the coronavirus gathered pace in Europe we saw relatively small outflows in February (around €1.5 billion) and large outflows in March (around €7.5 billion), but since then we’ve seen inflows: year-to-date net flows as of 29 July are -€1.9 billion.2
Market liquidity in underlying bonds has been challenging, but has improved over the past few months. When high yield is performing well the market trades on a price, usually 0.5 or 1.0 point. During a wobble the bid-offer spread widens to 2 points. At the end of March the spread was between 3 and 5 points on screen; in reality it could have been as many as 10 points lower than the screen price.3
This has improved tremendously, but is still not back to pre-Covid-19 levels, with the bid-offer at around 1.5 points, and shorter maturities perhaps at around 1 point. A lot of companies tapped into the government guarantee packages, which supported the front end of the yield curve. In fact, a recent report from Deutsche Bank showed that around 10% of European high yield issuers are now in receipt of state support.4
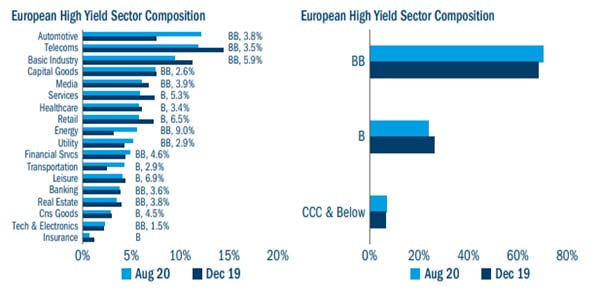
A new High Yield landscape
Outlook
Implied interest rates in the US, Europe and for sterling suggest little will change, and if they do it will be further falls. So we expect central banks to continue to extend support.
In terms of corporates, earnings will be impacted negatively. Balance sheets were generally OK coming into the downturn, and now they are supported by masses of liquidity. Spreads have widened and tightened significantly in a relatively short period of time, from one quarter to the next, but this movement was still muted compared to during the global financial crisis. And while estimates of default rates in Europe were close to double digits (and in the US as high as 14%), these haven’t emerged, the stimulus has seen these revised lower to around 4%.5 Liquidity is key, with high leverage not a focus. As long as firms can pay their bills they will live to fight another day.
However, the market bifurcation between better quality names and weaker names continues. A key consideration is the strength of a firm’s balance sheet going into the crisis. Those strong enough to survive a longer economic downturn will probably receive sufficient liquidity; those who already had weak balance sheets will find it more difficult. Another key consideration is will there still actually be a business when recovery returns?
With central bank support getting wider and deeper, we don’t imagine many companies going bust due to liquidity issues. But ultimately individual companies have to show they have a sustainable business model post-corona. Ultimately, we need to see if all of the fiscal and monetary measures are sufficient to prevent a severe and prolonged recession. From today’s perspective, this looks rather difficult to judge.
Q2 earnings saw big beats to the upside, and technicals remain very strong. Valuation spreads at 4856 feel as though you are being appropriately compensated at the 4% default risk. Cyclicals are also making good progress on cost savings, which means companies are giving neutralto-positive cash flow guidance. On the flipside, however, a lack of guidance means the outlook is rather vague, and there is growing long-term uncertainty. Some sectors are not likely to see a V-shaped recovery shape, with autos for example looking towards 2024 for full recovery.

Source: Columbia Threadneedle, Bloomberg and Aladdin as at 31 August 2020.
The year-on-year numbers are key to seeing if that isn’t light at the end of the tunnel, rather an oncoming truck.
So far the European HY market has received support, with Fallen Angels boosting the universe by around 20%,7 and the market seeing the biggest ever July numbers, which were easily absorbed.
If you believe the 4% default expectation is accurate, then current spreads cover you for that; less so if you feel the long-term picture is more uncertain. That’s where we as a team currently find ourselves.


